
Free tool
GLP-1 Weight Loss Calculator: 12-Month Projection From the Trials
Enter your starting weight and this GLP‑1 weight loss calculator draws the next 12 months on the average trial curve. For tirzepatide 15 mg that is the 20.9% mean loss at week 72 of SURMOUNT-1 (Jastreboff et al., NEJM 2022); for semaglutide 2.4 mg, the 14.9% at week 68 of STEP 1 (Wilding et al., NEJM 2021). From 220 lb, month 12 comes out near 180 lb on tirzepatide and 191 lb on semaglutide.
- lb
Weight forecast
Your curve shows here, at your own dates.

Choose the dose you expect to stay on and add your weight to see your curve.

How to use this calculator
- Choose the dose you expect to stay on: tirzepatide 5, 10 or 15 mg, the three SURMOUNT-1 arms, or semaglutide 2.4 mg from STEP 1 or 7.2 mg from its 72-week trial.
- Enter your starting weight in pounds, kilograms or stones.
- If you have started, enter the date and your weight today to see where you sit against the trial curve and its placebo line at your week. If not, add a date that matters to read your weight on it; before you start, the three tirzepatide doses show as a range.
- Read the weight at your date and at month 12, and, if you add a goal, the month the average curve reaches it.
The result is the trial average scaled to your weight, not a forecast for you. People on a lower dose, and people with type 2 diabetes, lost less in the trials; their numbers are further down this page.
How the curve is built
The curve rises fast and then flattens toward the trial’s mean loss. The share of that mean reached by month m is 1 − e^(−k × m), where k = 3 ÷ the trial’s length in months. STEP 1 ran 68 weeks, which the calculator rounds to 16 months; SURMOUNT-1 ran 72 weeks, rounded to 17 months.
Projected loss (%) = trial mean × (1 − e^(−k × m)). Projected weight = starting weight × (1 − projected loss ÷ 100).
Because 1 − e^(−3) = 0.95, the curve reaches 95% of the trial mean at month 16 or 17 and never passes the mean. At the trials' own endpoints it reads 19.9% for tirzepatide and 14.2% for semaglutide, a little under the published means. At month 12 it shows 88% of the SURMOUNT-1 mean and 89.5% of the STEP 1 mean.
Worked example, 220 lb on tirzepatide: k = 3 ÷ 17 = 0.176. At month 12, 1 − e^(−0.176 × 12) = 1 − 0.120 = 0.880. The projected loss is 20.9% × 0.880 = 18.4%, so the weight is 220 × (1 − 0.184) = 179.6 lb. The calculator shows 180 lb and 40 lb lost.
The table runs the same formula from 220 lb at months 3, 6, 9 and 12.
| Month | Tirzepatide 15 mg (lb) | Tirzepatide loss (%) | Semaglutide 2.4 mg (lb) | Semaglutide loss (%) |
|---|---|---|---|---|
| 3 | 201.1 | 8.6 | 205.9 | 6.4 |
| 6 | 190.0 | 13.7 | 197.9 | 10.1 |
| 9 | 183.4 | 16.6 | 193.3 | 12.1 |
| 12 | 179.6 | 18.4 | 190.7 | 13.3 |
The trial numbers the calculator uses

Apart from the 7.2 mg curve, every constant in the calculator comes from one of two trials: SURMOUNT-1 (Jastreboff et al., NEJM 2022) and STEP 1 (Wilding et al., NEJM 2021). The 20-week tirzepatide escalation is from the SURMOUNT-1 paper. The 16-week semaglutide escalation is from the Wegovy prescribing information, section 14, which reports STEP 1 as Study 2.
| Constant | Tirzepatide (SURMOUNT-1) | Semaglutide (STEP 1) |
|---|---|---|
| Dose modelled | 15 mg weekly | 2.4 mg weekly |
| Mean weight change | −20.9% at week 72 | −14.9% at week 68 |
| Placebo | −3.1% | −2.4% |
| Curve length used (months) | 17 | 16 |
| Dose escalation inside the trial | 20 weeks | 16 weeks |
| Adults randomized | 2,539 | 1,961 |
The trial means already include the escalation weeks, so month 1 of the curve is your first month on the drug, not your first month on the top dose. Both trials enrolled adults without diabetes who had a BMI of 30 or more, or 27 or more with a weight-related condition, and both added lifestyle support.
Other doses and the 7.2 mg Wegovy dose
Besides 15 mg, the calculator offers the SURMOUNT-1 5 mg and 10 mg arms and the 7.2 mg Wegovy dose. SURMOUNT-1 also tested 5 mg and 10 mg of tirzepatide, with mean losses of 15.0% and 19.5% at week 72 (Jastreboff et al., NEJM 2022).
Wegovy now goes up to 7.2 mg for people who have tolerated 2.4 mg for at least 4 weeks. In its 72-week trial, the 7.2 mg group lost 18.8% against 15.5% on 2.4 mg (Wegovy prescribing information, section 2.2 and Table 12). The calculator draws 7.2 mg from that trial, against its 3.9% placebo mean; every brand’s dose steps are in the GLP‑1 dose conversion chart.
The tirzepatide and semaglutide options come from separate trials in different people, so the gap between their curves is not a head-to-head result. In SURMOUNT-5, the direct comparison, tirzepatide gave 20.2% and semaglutide 13.7% at week 72, each at the highest dose people tolerated (Aronne et al., NEJM 2025).
Why weight loss slows after the first months

In STEP 4, people on semaglutide 2.4 mg lost 10.6% in a 20-week run-in, then a further 7.9% over the next 48 weeks (Rubino et al., JAMA 2021). In SURMOUNT-4 (Study 4 in the Zepbound label), tirzepatide took off 20.9% in a 36-week lead-in and a further 5.5% from week 36 to week 88 (Zepbound prescribing information, section 14, Study 4).
Both lead-in figures count only the people who went on to randomization: those who reached 2.4 mg in STEP 4, and those on 10 or 15 mg in SURMOUNT-4. The calculator’s curve starts more gently. It puts semaglutide at 8.6% after 20 weeks and tirzepatide at 16.1% after 36 weeks. For the results the trials printed at each time point, see the Wegovy results timeline and Mounjaro weight loss by month.
If your own loss sits below the curve for several weeks, what to check during a weight loss plateau starts with whether the stall is real, then missed doses, the vial, protein and training.
What the projection leaves out
The curve follows the average, and individual results in the trials spread well either side of it. In STEP 1, 86.4% of people on semaglutide lost at least 5%, 69.1% lost at least 10% and 50.5% lost at least 15% (Wilding et al., NEJM 2021). On tirzepatide 15 mg in SURMOUNT-1, 91% lost at least 5% and 57% lost 20% or more (Jastreboff et al., NEJM 2022).
The curve also assumes you keep taking the medicine. In SURMOUNT-4, people switched to placebo after the lead-in gained 14.0% between week 36 and week 88 (Zepbound prescribing information, section 14). The longer trials of stopping are compared in weight regain after stopping.
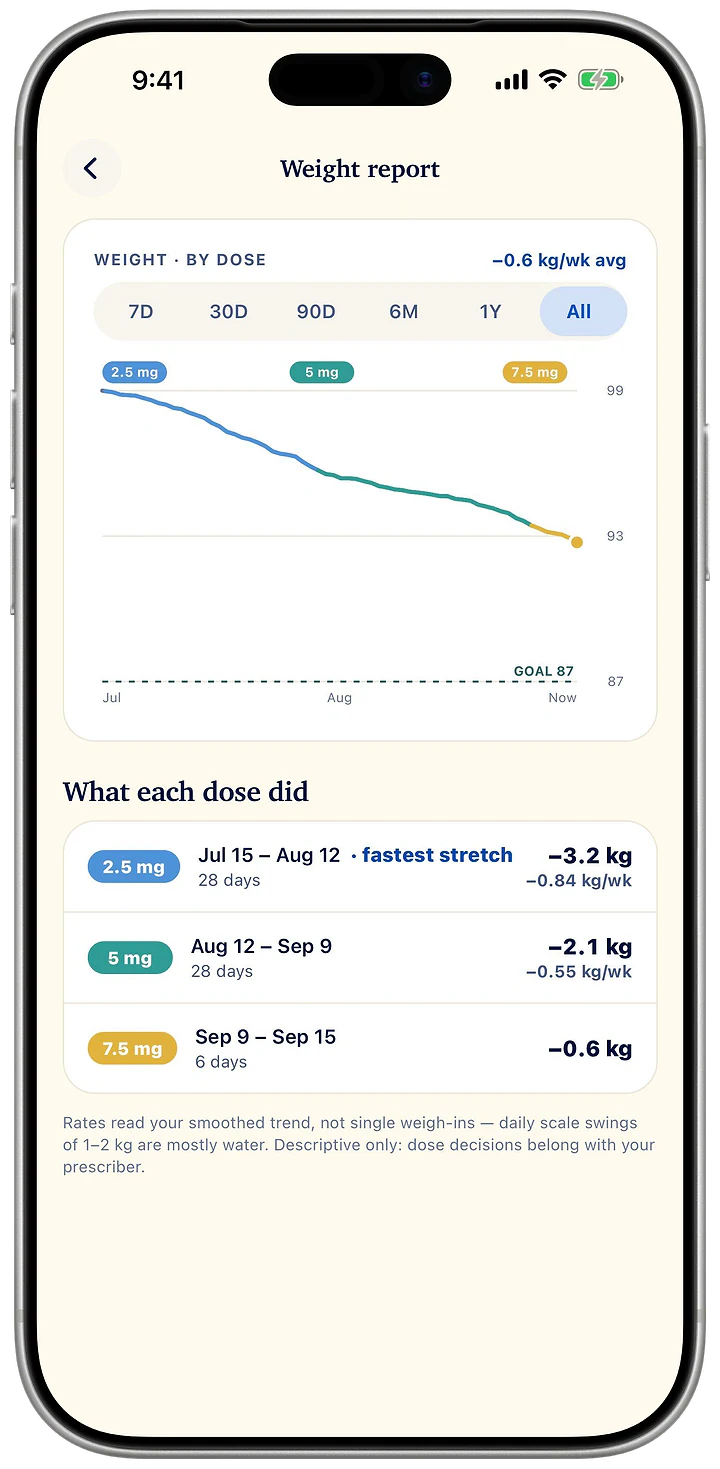
The GLP‑1 goal weight calculator shows where your 12-month weight sits against a healthy BMI for your height, and the GLP‑1 cost per pound calculator divides your monthly spend by the loss. To compare the projection with your real trend, chart your weigh-ins in Pensday, where weight logging is free.
Questions
Frequently asked questions
How much weight can you lose on tirzepatide?
In SURMOUNT-1, mean weight loss at 72 weeks was 15.0% on 5 mg, 19.5% on 10 mg and 20.9% on 15 mg of tirzepatide, against 3.1% on placebo (Jastreboff et al., NEJM 2022). On 15 mg, 57% of participants lost 20% or more.
What is the semaglutide weight loss timeline?
Semaglutide 2.4 mg reached a mean 14.9% loss at week 68 in STEP 1 (Wilding et al., NEJM 2021). That total includes the first 16 weeks, while the dose was still being raised (Wegovy prescribing information, section 14). The calculator’s curve, built from that mean, puts the loss at 6.4% by month 3, 10.1% by month 6 and 13.3% by month 12.
Does the projection apply if I have type 2 diabetes?
Expect less than the curve shows. In people with type 2 diabetes, Zepbound 10 mg and 15 mg gave 12.8% and 14.7% at 72 weeks (Zepbound prescribing information, Table 2), and Wegovy 2.4 mg gave 9.6% at 68 weeks (Wegovy prescribing information, Table 8). The calculator uses the trials in people without diabetes.
Does weight keep dropping after 12 months on Zepbound?
Yes, but more slowly. In SURMOUNT-4, people who stayed on Zepbound after a 36-week lead-in lost a further 5.5% by week 88 (Zepbound prescribing information, section 14). The calculator’s chart runs to month 12, or 6 months past your own month, and stops at the trial’s own 17 months.
Sources
- Tirzepatide Once Weekly for the Treatment of Obesity (SURMOUNT-1). New England Journal of Medicine, 2022.
- Once-Weekly Semaglutide in Adults with Overweight or Obesity (STEP 1). New England Journal of Medicine, 2021.
- Effect of Continued Weekly Subcutaneous Semaglutide vs Placebo on Weight Loss Maintenance in Adults With Overweight or Obesity (STEP 4). JAMA, 2021.
- Tirzepatide as Compared with Semaglutide for the Treatment of Obesity (SURMOUNT-5). New England Journal of Medicine, 2025.
- Zepbound (tirzepatide) injection, prescribing information. Eli Lilly and Company, 2026.
- Wegovy (semaglutide) injection and tablets, prescribing information. Novo Nordisk, 2026.
Results are estimates from the published figures in these sources. They are not a measurement or medical advice.
Pensday is a tracking app. It does not give medical advice; talk to your prescriber about your dose.
Pensday is not affiliated with Novo Nordisk or Eli Lilly. Ozempic, Wegovy, Rybelsus, Saxenda and Victoza are trademarks of Novo Nordisk A/S. Mounjaro, Zepbound and Trulicity are trademarks of Eli Lilly and Company.
Related reading
Related tools
Pensday for iPhone and Android
See what each dose did.
A free weekly trend on each dose, drawn from your own weigh-ins.