
Dosing and titration · Trackers and apps
How to Read a GLP‑1 Dose Curve and Why Plotters Disagree
A GLP‑1 dose curve climbs for 4 to 5 weeks at each new dose, then dips to 38 to 50% of its peak before a shot. Plotters differ on half-life and units.
Medically reviewed by Farnia Bahari, PharmD
Published 6 min read
At each new dose of semaglutide or tirzepatide, the level on a GLP‑1 curve climbs for 4 to 5 weeks, then peaks and dips every week (Ozempic label; Mounjaro label). Before each shot it sits at about 50% of the peak on semaglutide and 38% on tirzepatide. Plotters disagree when they use different half-lives, units or absorption models.

Key facts
- The labels put semaglutide’s half-life at about 1 week and tirzepatide’s at about 5 days, which sets how much of each dose remains at the next shot (Ozempic, section 12.3; Mounjaro, section 12.3).
- The level peaks 1 to 3 days after each semaglutide injection and a median 24 hours (range 8 to 72) after tirzepatide (Ozempic, section 12.3; Zepbound, section 12.3).
- Stepping up starts a fresh climb toward a plateau that scales with the dose, so 7.5 mg after 5 mg settles 1.5 times higher (7.5 ÷ 5).
- The Zepbound label puts the person-to-person spread in tirzepatide clearance at about 20%, as a coefficient of variation (Zepbound, section 12.3).
- A 6-day tirzepatide half-life, the top of the Zepbound label’s range, gives a plateau about 12% higher than a 5-day one (1.80 ÷ 1.61 = 1.12).
Where you are on the curve

Your place on the curve depends on when your current dose started and when you took your last shot. Timings are from section 12.3 of the prescribing information (Ozempic, Zepbound).
| Where you are | What the level does | Related guide |
|---|---|---|
| First 4 to 5 weeks on a dose (4 on tirzepatide) | Climbs with each shot | When appetite suppression starts |
| 1 to 3 days after a semaglutide shot, about 24 hours after tirzepatide | Peaks for the week | Side effects in the days after a shot |
| The day before the next shot | Dips to about half the peak on semaglutide, 38% on tirzepatide | Hunger that returns before the next shot |
| After the last shot | Halves once per half-life | Tapering off semaglutide |
The climb happens because each weekly dose lands before the last one has cleared. Half of a semaglutide dose is still there a week later. For tirzepatide it is 38%, which is 0.5 raised to the power 1.4 (7 days ÷ 5 days). Adding the doses up week by week gives the share of the steady-state level reached after each shot at the same strength.
| Weekly doses at one strength | Semaglutide (% of steady state) | Tirzepatide (% of steady state) |
|---|---|---|
| 1 | 50 | 62 |
| 2 | 75 | 86 |
| 3 | 88 | 95 |
| 4 | 94 | 98 |
| 5 | 97 | 99 |
That arithmetic lands where the labels do, with steady state after 4 to 5 weeks of semaglutide and 4 weeks of tirzepatide (Ozempic, section 12.3; Zepbound, section 12.3). Each dose increase starts a new 4 to 5 week climb, from the old plateau to a higher one. The GLP‑1 plotter draws this curve from your last shot’s date and dose and shows when the next dip comes.
After the last shot, semaglutide falls to about 50%, 25% and 13% of the peak 1, 2 and 3 weeks later. It stays in the circulation for about 5 weeks after a final Ozempic dose and for 5 to 7 weeks after a final Wegovy dose (Ozempic, section 12.3; Wegovy, section 12.3). Tirzepatide falls faster on the same arithmetic, to 38%, 14% and 5%.
Why two plotters give different numbers
The half-life, the absorption model, the units and the share of a dose that is absorbed each change what a plotter draws for the same shot. Section 12.3 of each label gives the values a plotter can choose from (Mounjaro, Zepbound, Ozempic).
| Setting | Choices | Effect on the curve |
|---|---|---|
| Tirzepatide half-life | 5 days (Mounjaro) or 5 to 6 days (Zepbound) | At 6 days the plateau is about 12% higher |
| Absorption | Modeled or left out | Left out, the peak sits at the injection |
| Units | mg in the body, nmol/L, or an index | Only nmol/L can be checked against a label |
| Absorbed share | 89% (semaglutide), 80% (tirzepatide) | Sets the height when a plotter uses it |
With a 6-day half-life, 45% of a tirzepatide dose is left after a week instead of 38% (0.5 raised to the power 1.17, or 7 days ÷ 6 days). The plateau then rises from 1.6 to 1.8 times a single dose. A model with no absorption phase draws the peak at the moment of injection, 1 to 3 days (semaglutide) or about 24 hours (tirzepatide) earlier than the labels place it.
The Wegovy label gives an average steady-state level of about 75 nmol/L on 2.4 mg weekly (Wegovy, section 12.3), so a plotter that prints nmol/L can be checked against it. One that shows the level as a multiple of a single dose, as the GLP‑1 plotter does, has no label figure to match.
How accurate is the curve?
The curve shows a typical patient’s level, and yours can sit above or below it. Tirzepatide clearance varies between people with a coefficient of variation of about 20% (Zepbound, section 12.3). Semaglutide exposure falls as body weight rises, though the Ozempic label calls 0.5 mg and 1 mg adequate across 40 to 198 kg (Ozempic, section 12.3).
The GLP‑1 plotter uses one label half-life per drug and no absorption phase, and it assumes regular shots on the schedule you give it. A late or skipped dose you do not enter moves your real curve away from the modeled one.
A dip on the chart is no reason to add a dose. Splitting the weekly dose into two half-doses 3.5 days apart would lower the model’s peak and raise its trough. The Wegovy and Zepbound labels still give each dose as one injection once a week (Zepbound, section 2.2; Wegovy, section 2.2).
From 5 mg to 7.5 mg, week by week
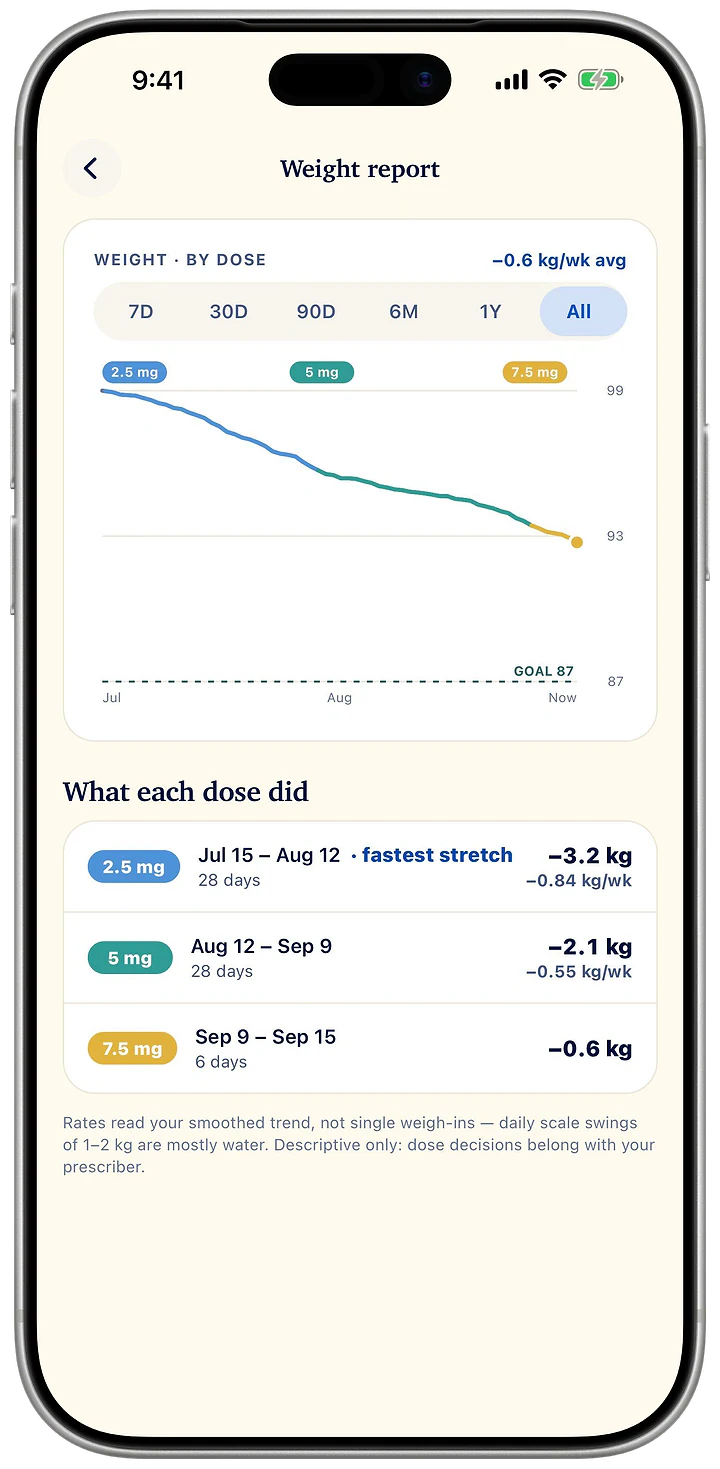
The Zepbound label allows a step up in 2.5 mg increments after 4 weeks or more on the current dose (Zepbound, section 2.1). Set the 5 mg steady-state peak at 100. A single 5 mg dose adds 62, because 100 × (1 − 0.38) = 62, so a single 7.5 mg dose adds 93. Each week, 38% of the level carries into the next.
Week 1 at 7.5 mg is the 38 left from the last 5 mg dose plus 93, which is 131. Week 2 is 131 × 0.38 + 93, which is 143, and each later week repeats the sum.
| Week at 7.5 mg | Peak level (5 mg steady state = 100) | Share of the rise completed (%) |
|---|---|---|
| 1 | 131 | 62 |
| 2 | 143 | 86 |
| 3 | 147 | 95 |
| 4 | 149 | 98 |
| Steady state | 150 | 100 |
In the first week on 7.5 mg the level is still about 13% below where it settles (131 against 150). By week 4 it is within 1 point of the new plateau. A semaglutide step works the same way with half of each dose carried over, and the Ozempic and Wegovy ladders set the size of each step.
Reading the curve against your own log

Set each logged symptom against the day of your dosing week. Nausea logged a day or two after a shot lines up with the peak, and hunger that returns the day before a shot lines up with the trough. Appetite that keeps shrinking through the first month on a new dose tracks the climb.
A curve drawn from the shots you actually took, late ones included, and your side effects logged beside each dose are both in Pensday, one of the tracker apps that chart GLP‑1 levels.
Questions
Frequently asked questions
How long until GLP‑1 levels reach steady state?
About 4 to 5 weeks of weekly semaglutide and 4 weeks of weekly tirzepatide at the same strength (Ozempic prescribing information; Zepbound prescribing information). By the fourth dose, a half-life model puts semaglutide at 94% of its plateau and tirzepatide at 98%.
Does a higher dose change the shape of the curve?
No. Exposure to both tirzepatide and semaglutide rises in proportion to the dose (Zepbound prescribing information, section 12.3; Ozempic prescribing information, section 12.3). A bigger dose scales the whole curve up, and its peaks and dips keep their timing.
Does the injection site change the curve?
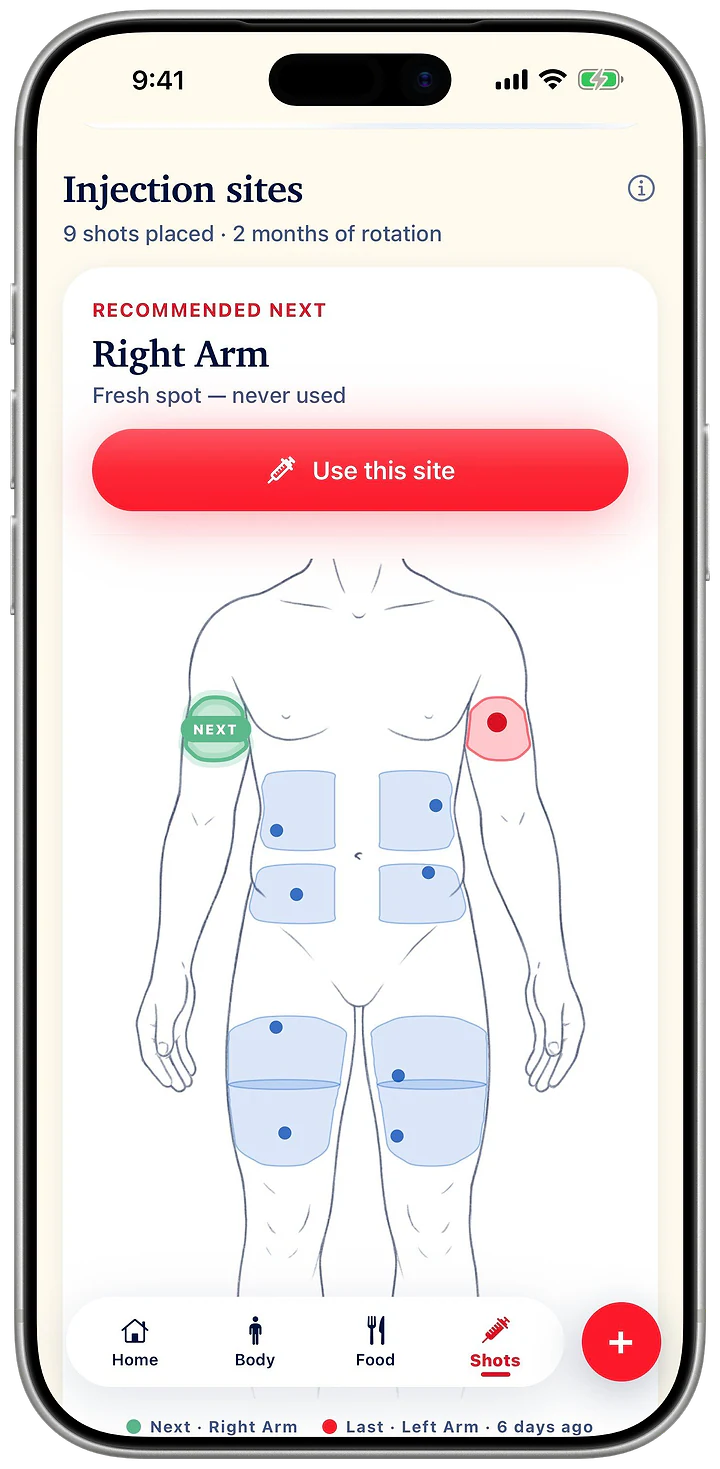
Not in the label data. The Ozempic, Wegovy and Zepbound labels report similar exposure after injection in the abdomen, thigh or upper arm (Ozempic, Wegovy and Zepbound prescribing information, section 12.3). On Zepbound and Mounjaro, the back of the upper arm is for another person to inject (Zepbound prescribing information, section 2.4; Mounjaro prescribing information, section 2.2).
How much does a late dose change the curve?
A tirzepatide dose taken 2 days late comes 9 days after the last one. By then 0.5 raised to the power 1.8 (9 days ÷ 5 days) leaves 29% of the level instead of 38% (Mounjaro prescribing information). The level just before the late shot is about 24% lower than a normal trough.
Does a weekly-shot plotter work for the Wegovy pill?
No. Wegovy tablets are taken once a day, reach their peak about 1 hour after the dose and absorb only about 1% to 2% of their semaglutide (Wegovy prescribing information, section 12.3). A weekly-injection model allows for none of that.
Sources
- Ozempic (semaglutide) injection, prescribing information. Novo Nordisk, 2026.
- Wegovy (semaglutide) injection and tablets, prescribing information. Novo Nordisk, 2026.
- Mounjaro (tirzepatide) injection, prescribing information. Eli Lilly and Company, 2026.
- Zepbound (tirzepatide) injection, prescribing information. Eli Lilly and Company, 2026.